The content is structured as follows:
Set up Octoblu
Connect with Developer Portal
Create flow in Octoblu
Connect Freeboard
Create Dashboard
Overview
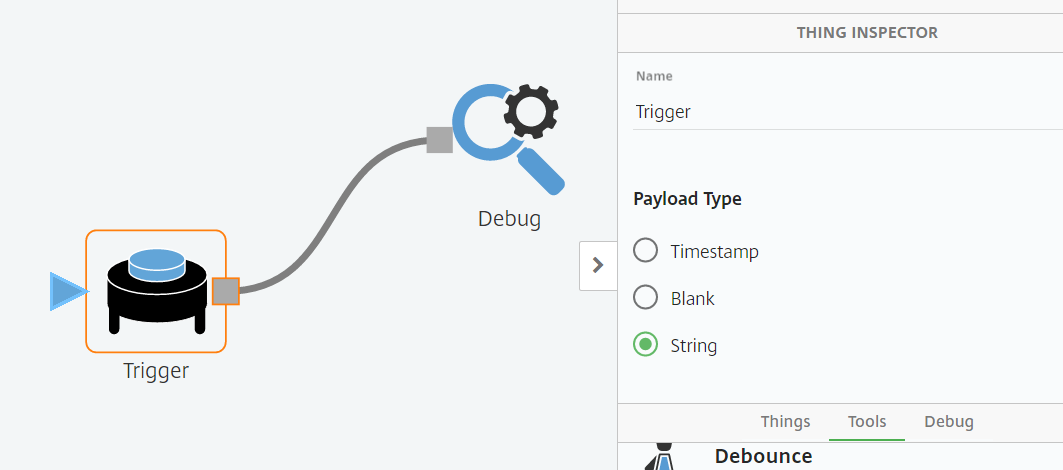
Set up Octoblu
To start get an Octoblu account at https://www.octoblu.com/. When you open your account go to the dashboard. Create a new flow and give it a relevant name. Now you are ready to create your own flow. A 'Trigger' can be used to receive data from the developer portal. Input a ‘Trigger’ from the tools button. Set the payload type to String and connect it with a ‘Debug’ tool. This is all that is needed to receive messages.
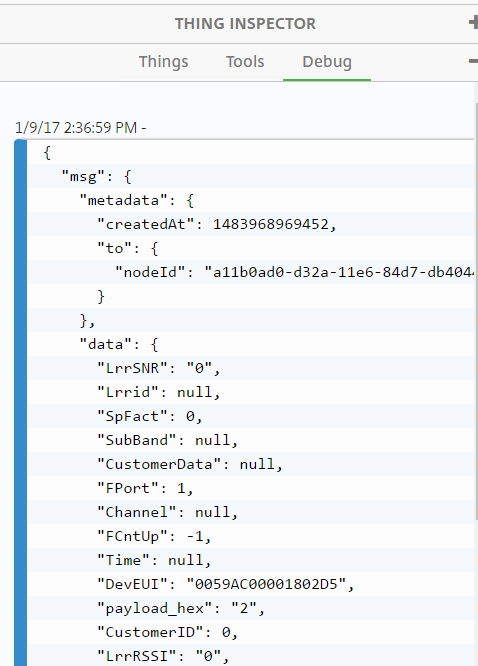
Connect with Developer Portal
Since the flow in Octoblu is ready to receive messages a platform from where they can be send is neccesary. In the developer portal it is possible to conncect a LoRa device. For this example simulated uplink messages are used. Go to the develop portal (kpn.com/loradeveloperportal). Log in or register and add a device. Give it a relevant name. For the 'destination url' go back to Octoblu. Select the trigger and copy the link from 'HTTP post'. Use this link in the developer portal as destination url. Use the test uplink button in the developer portal to send a message to trigger your flow in Octoblu. If you switch back to Octoblu you should see a J-SON message in the debug tab with the payload you gave in the developer portal.
Create flow in Octoblu
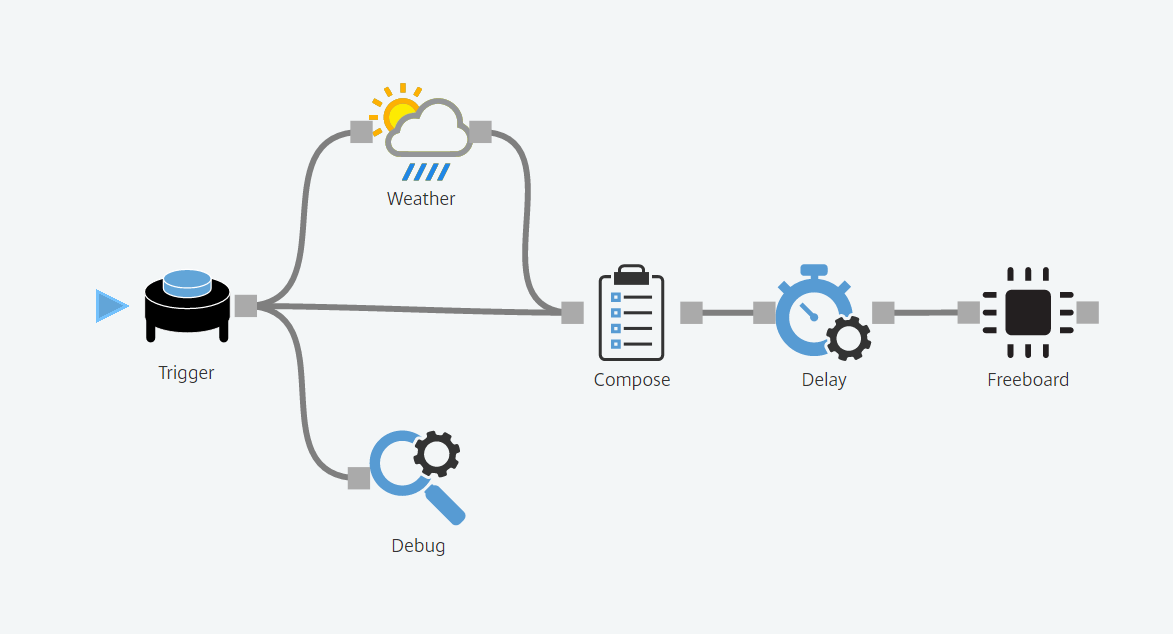
It is now possible to send sensor data through the developer portal to Octoblu. It might be beneficial to compare this data with a different source. For example for temperature OpenWeatherMap can be used. Connect the ‘Weather’ ‘thing’ (this is how these are called in Octoblu) to the trigger. Everytime the trigger receives LoRa data from the developer portal it will also check the OpenWeatherMap data.
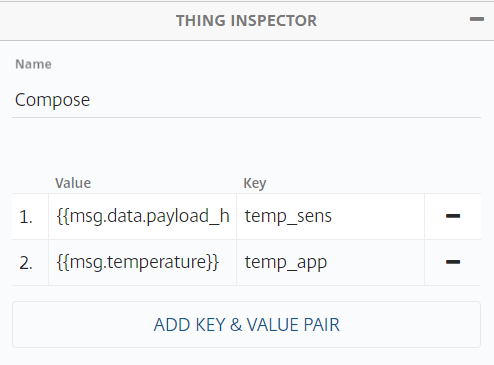
To combine these two data types into one message the ‘Compose’ thing is used. In this example the LoRa data can be extracted from the J-SON with {{msg.data.DevEUI_uplink.payload_hex}} and the OpenWeatherMap data with {{msg.temperature}}. Give relevant names (keys). To make sure both data types arrive in the same message a ‘delay’ tool is used.
Connect Freeboard
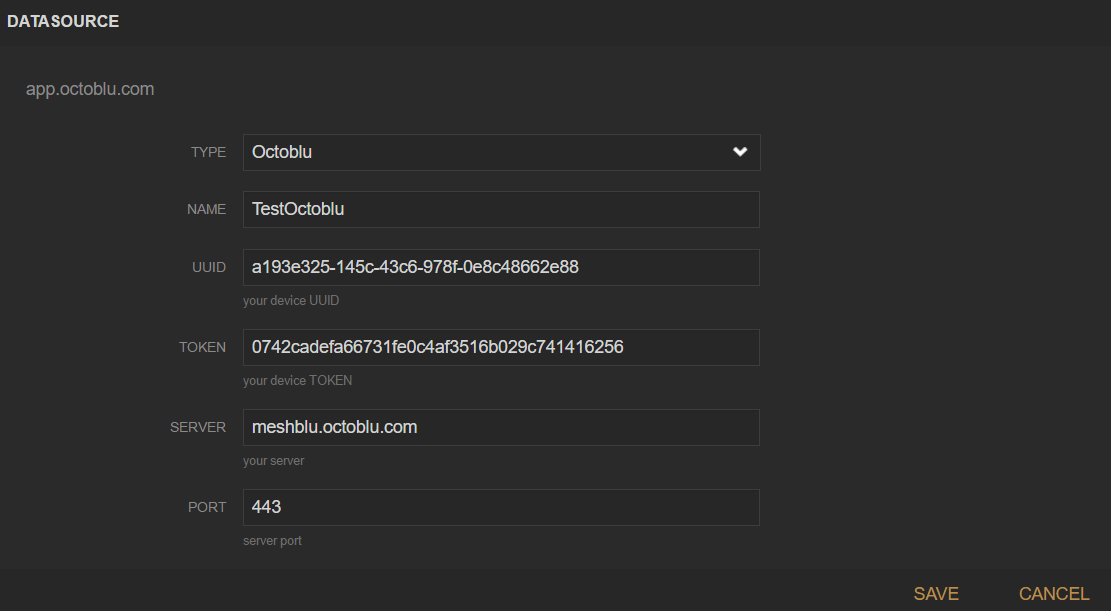
Octoblu currently does not have a tool or thing for a dashboard but we can use Freeboard to visualize the data. Follow the steps described in the link to connect Octoblu and Freeboard: https://github.com/octoblu/freeboard. Connect the newly created 'Freeboard' thing to the Octoblu flow (make sure to set ‘use incoming message’ on) and you are ready to receive and visualize data. Send a test uplink message from the developer portal to check if no errors occur.
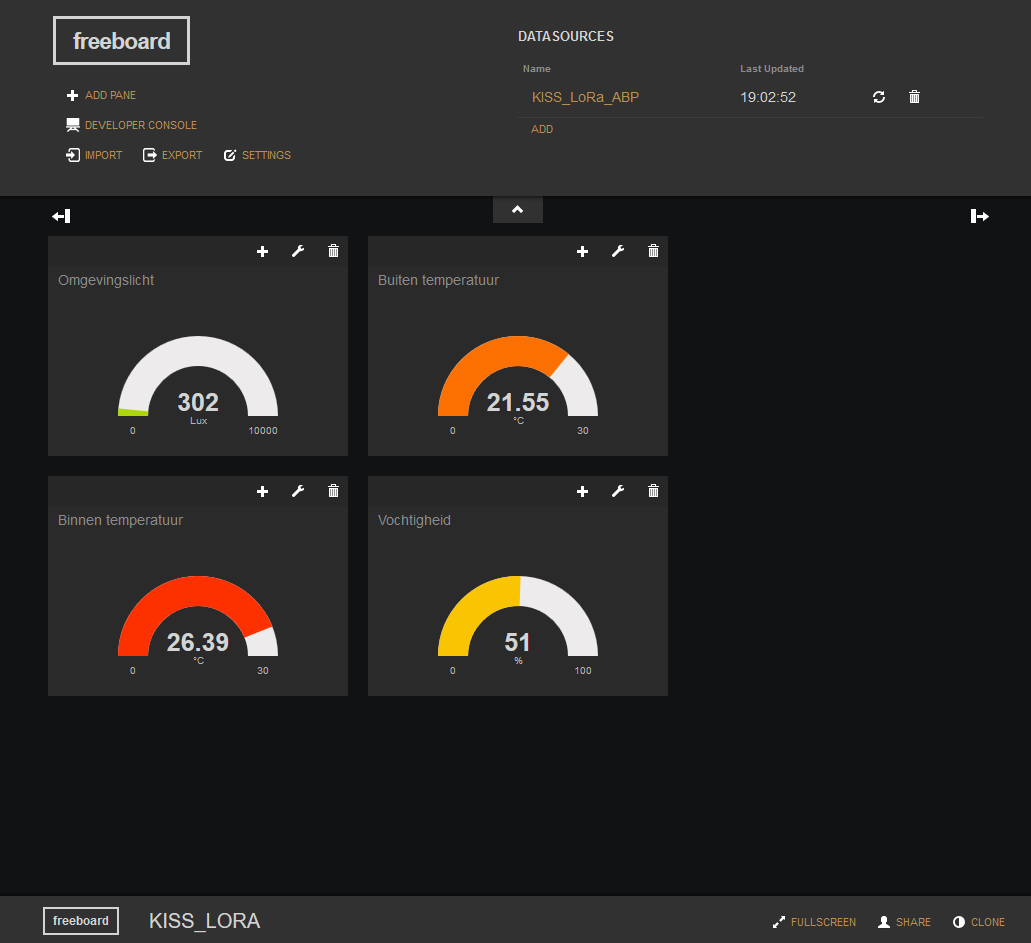
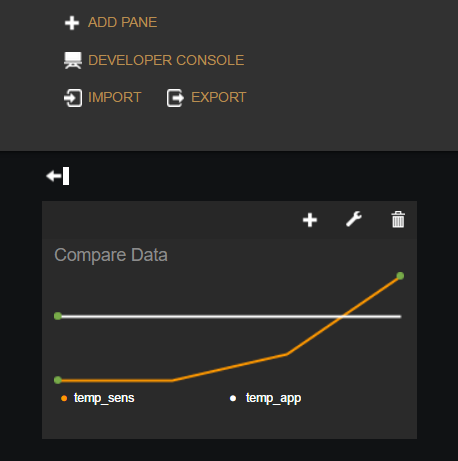
Create Dashboard
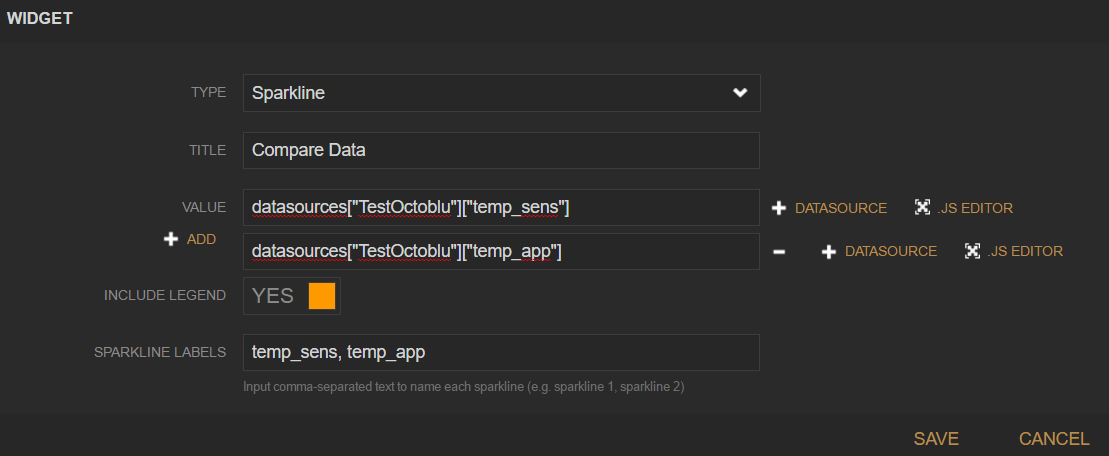
If everything goes as planned go to your freeboard on freeboard.io. Select ‘add pane’ and then add type ‘sparkline’. It is possible to combine two data sources in this graph. In our example the temp_sens and temp_app are used. Save the pane and send some data from the developer portal. The sparkline should show the temperature send from the test message and the temperature from the OpenWeatherMap.
Overview
You should now be able to use Octoblu to receive LoRa messages and visualize them using Freeboard. This was just a simple example of what can be possible using Octoblu. If you have any questions/remarks/comments please feel free to post them. If you want to share your own tutorial or your LoRa/IoT project we are also very curious!
Useful links
- LoRa: Starters Guide
- LoRa: Forum and Manuals
- LoRa: Geolocation
- LoRa: Dictionary & Definitions
- Tools: www.LoRaTools.nl
- Tools: Freeboard and Octoblu
- Tools: IoT Academy Github
- FAQ: Frequently Asked Questions