Set up Node-RED
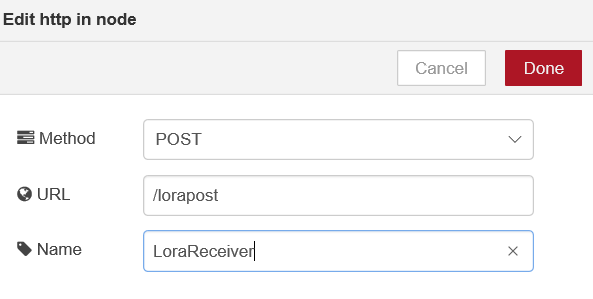
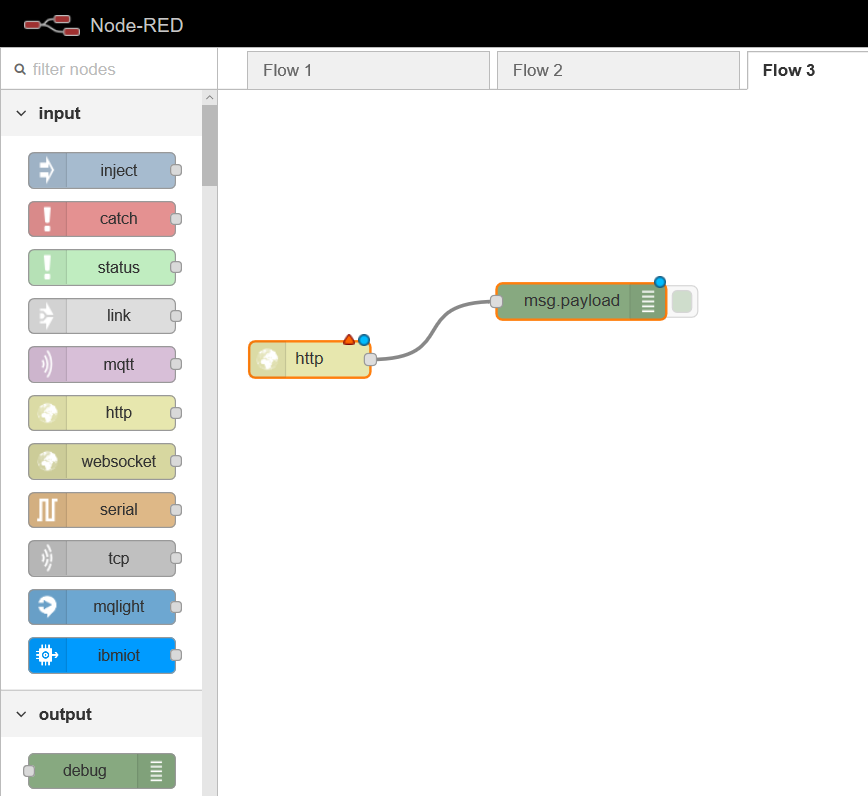
A Node-RED server is needed and can be set up as described in https://github.com/iotacademy/NodeRed_KPN_LoRa/wiki/Setting-up-a-NodeRed-Server-in-Bluemix. When you are finished go to the node-RED flow editor. For this example things are kept simple and there is started with a 'http' node. Set the method to POST and give the url and the node a relevant name:
Set up Developer Portal
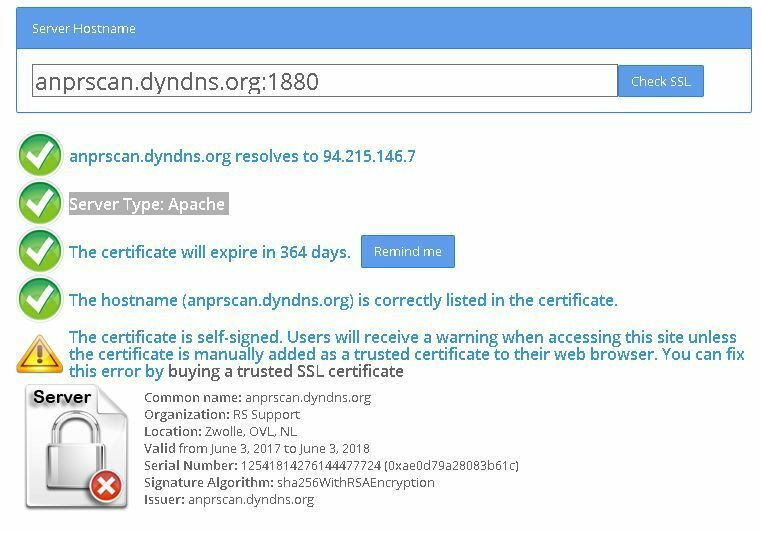
Since it is now possible to receive LoRa messages it is time to connect a LoRa device. Go to kpn.com/loradeveloperportal and create an account (if you don't have any already). Log in and add a device. You will be asked to give a device name and a destination. Give it a nice name and for the destination you need to use Node-RED. The link for the destination should be something like: https:// (your project name).eu-gb.mybluemix.net/lorapost (depended on the url you gave in the 'http' node).
This is our
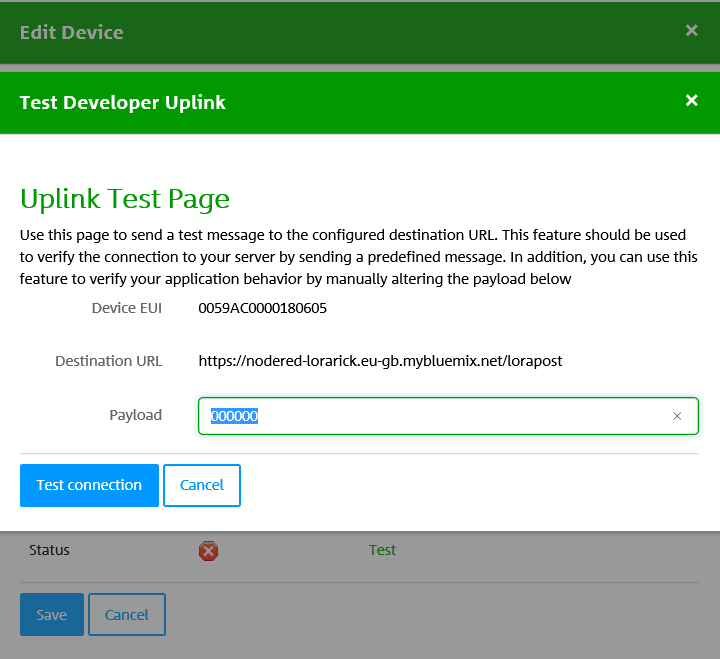
first LoRa device. It is not attached to a physical one, but we can send test (uplink) messages to Node-RED. Select the 'Edit' button and hit the 'Test Uplink' button.
Give some payload, for example 30 and hit 'Test connection'. This will send a message to Node-RED. To check if this is true go to the Node-RED flow editor and select the 'debug' tab. Here you should see a message with payload_hex "30".
Let's assume we have a temperature sensor attached to our LoRa device and we want to visualize this data. It is possible to create a simple dashboard.
Extract data from message
Firstly the payload_data is extracted from the original J-SON message. We use a function block with the code
code:
msg.payload = msg.payload.payload_hex;
return msg;
Attach a debugger to check if the correct message is extracted.
Create dashboard
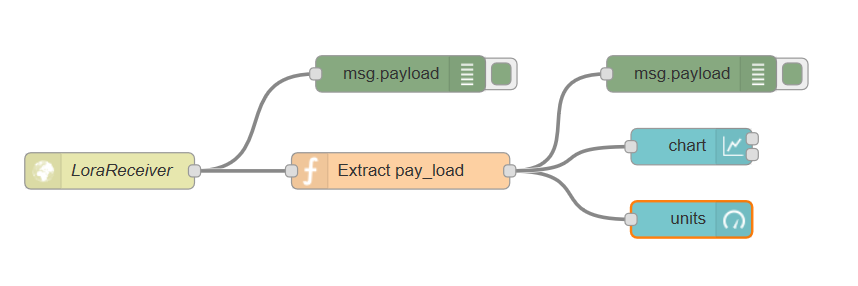
After extracting the temperature it is possible to create a dashboard. In Node-RED go to options (the three horizontal lines in the top right corner) and select 'manage palette'. Select 'install' and search for dashboard and install 'node-red-dashboard'. After reloading the page you should be able to see the new dashboard nodes. Connect a 'gauge' and a 'chart' node to the function node. Your flow should look similar to:
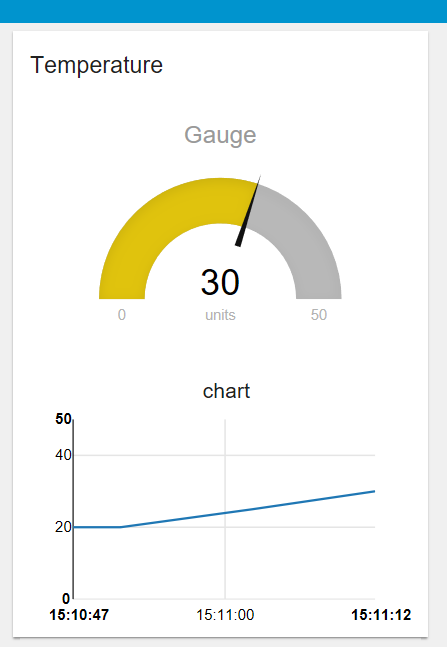
Configure the dashboard nodes, use convenient names. Set the X-axis and Y-axis as you want. Configure the group to make it fit into your user interface.
Hit deploy and go tohttps:// https://(your project name).eu-gb.mybluemix.net/ui. Here you should see a chart and a gauge. Use the developer portal to send some test temperatures. If everything goes as planned you should see the data displayed in your dashboard.
Overview
After reading this topic it should be clear how to create a simple dashboard for your LoRa data using Node-RED. If you have any questions/additions/remarks please post them in the comments. Also, feel free to post your own tutorial/usecase on this forum!
Handige links
- LoRa: Starters Guide
- LoRa: Forum and Manuals
- LoRa: Geolocation
- LoRa: Dictionary & Definitions
- FAQ: Frequently Asked Questions
- Tools: www.LoRaTools.nl